Narrative And Commentary

by A.J. Coltrane

Ken Pomeroy made some great points in February of 2012 (subscriber only):

…It’s the manufactured stories that attempt to explain the often-unexplainable variability in a team’s performance that I take issue with. Some team salvages its season by going on a late winning-streak and the origins of the streak are explained by a players-only meeting or the team captain stepping up and being a leader, or a renewed emphasis on defense, etc. When in reality, the causes of the change may have been more complicated that anyone could truly understand. (Naturally, this xkcd comic comes to mind.)

Murray State’s loss last week provided one of the clearest such examples of this method of analysis. The general assumption after the loss was that the Racers cracked under the pressure [(1), (2), (3)] of their unbeaten record. Even the coach said so! The thing is, Murray never reached a point during the season where they were better than a 50% proposition to go unbeaten in conference. You play enough games in which you are heavily favored, and you are going to lose eventually. Put more precisely, a team that plays ten games as a 90% favorite is expected to lose once during that span, and the Racers have played a lot of such games this season, including the game against Tennessee State…

and

…There’s lots of unexplained variance in a college basketball game. The Vegas line has long been proven to be the best predictor of outcomes, and while it has the reputation among some of being scarily accurate, the average error in the Vegas line is 8.4 points. And, with all due respect to other prognosticators out there, that’s the best we can do.

Keep in mind that 8.4 points of unpredictable variability is the combination of the variability of the two teams involved in a game. When Duke unexpectedly won at North Carolina last week, was it because Duke played better than usual and UNC played worse than usual, or was it because UNC played better than usual and Duke played much, much better than normal? Or was it because both teams played worse than usual, but UNC just really played badly? I think it’s nearly impossible to disentangle the two. If one team shoots poorer than expected, is it because their form was off or because the defense was better than usual? It is difficult to determine the answers to questions like this without some serious video breakdown…

I love the comic that Pomeroy linked, it’s exactly why I don’t listen much to the talking heads:
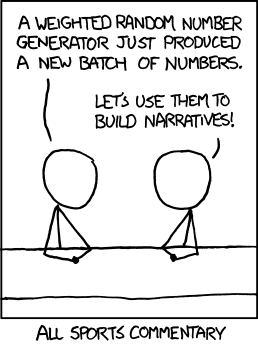
sports


A Few Thoughts About 39

by A.J. Coltrane

This SI piece talks about Rick Peterson, then of the A’s, managing the pitching staff to try to avoid the 39th batter in a game. (That’s the cleanup hitter’s 5th plate appearance.)

…Oakland’s Opening Day rotation that year had four lefthanded starters, and Peterson learned that it was best to use his righthanded-specialist, Chad Bradford, as a preemptive strike against tough righty hitters even before his starter was exhausted. The reasoning was often to avoid matchups two or three innings later as much as it was about a particular at-bat in the present.

Peterson asked the team’s analytics department to research the correlation of winning percentage with the number of batters faced in a game. That research, he said, found a tipping point between 38 and 39 batters faced.

“Once they came back with that information,” said Peterson, who advocates for the use of biomechanics and advanced analytics in pitching through his company 3P Sports, “that answered my question. You’ve got to manage your bullpen [because] it’s critical that the 3-hole hitter doesn’t come up for the fifth time.”

Here’s why: Since 1991 home teams that have faced fewer than 39 opposing batters in a nine-inning game — four full times through the lineup, plus three additional hitters — win roughly three-quarters of the time (74 percent) while teams that have faced 39 or more hitters have won only 31 percent of games.

Moreover, in the last 22 seasons home teams that have faced 39 opposing hitters have won almost exactly 50 percent of their games — 50.082 percent, to be more precise — making 39 the inflection point of winning or losing.

The piece is accompanied by this table:

Winning Percentage As Correlated With Batters Faced 1991-2012

Batters Faced Winning Percentage Batters Faced Winning Percentage
27 100.0 41 36.2
28 97.4 42 31.2
29 96.4 43 23.4
30 95.2 44 21.9
31 93.2 45 17.4
32 89.2 46 12.6
33 87.0 47 11.2
34 82.1 48 6.7
35 77.0 49 7.5
36 69.4 50 3.0
37 65.2 51 5.7
38 57.4 52+ 2.4
39 50.1 Summary 27-38 74.3
40 44.7 Summary 39+ 31.0

Now, is that really useful? Possibly to the pitching coach, though I’d think that there are a lot of other variables associated with it that make that observation fairly useless in practice.

Of course, the direct way to determine win probability is just to look at the scoreboard. Factoring in the runners on base, inning, and the out situation gives win probability, for an example check out the excellent post-game wrapups at Lookout Landing.

..and here’s a Win Probability Inquirer at the Hardball Times. That might a good link to save to the mobile device…

As a fan though, wouldn’t it be great to have a simple rule to know when the game is likely “over” without needing the assistance of an app? Maybe a high certainty to the results could be had with something like the following statement:  “If at any time during the game a team’s leadoff hitter has two more plate appearances than the opposition’s leadoff hitter, then the game has been decided at a 85% confidence level.” then “At three more plate appearances the certainty is 97%.”

For that matter it could be “If at any point after the 3rd inning one team has sent 10 more batters to the plate than their opponent then they’re 95% likely to win.” Maybe the number is 15. Maybe it’s 7… Maybe it’s the 5th inning and 8 batters…

I’m sure somebody knows this stuff, right?

A Veritable Cornucopia

By Blaidd Drwg

From Dave Schoenfield’s espn.com chat on 11/27:

Matt (Kansas City)
Would Lorenzo Cain, Johnny Giavotella, Jorge Bonifacio, Chris Dwyer, Mike Montgomery, and Bruce Chen be enough to land Giancarlo Stanton from a value and a Union standpoint?

David Schoenfield
(2:10 PM)
No. You don’t really see the poo-poo platter trades in MLB.

Hehe. He said poo.

As Homer Simpson would say, mmmm…sampler platter….

What Does That Mean, Really?

by A.J. Coltrane

From left to right:  Team Name, Kenpom Rank (minimum, top 50), 3-point percentage and rank, free throw percentage and rank, 3-point attempted quantity and rank. The ranks are relative to all 347 Division I teams.

Then it’s me screwing around with numbers. The “Vol” is the Volatility of the team. It’s 3P% x 3PA%. These are the teams that rely upon 3-pointers for a lot of their offense. If they get hot they can beat anybody, and if they get cold they could lose to anybody. Conversely, a team with a low “Vol” doesn’t take many 3’s and isn’t good at shooting them. A team with a low “Vol” isn’t likely to shoot itself out of, or back into, a game.

The “VR” is that team’s “Vol” rank among the top 150 teams according to Kenpom. (I didn’t care about the Weak Sisters Of The Poor.) “Vol” wound up ranging from 1658 to something like 800. The lowest team on the “top 50 Kenpom list” is NC State at 920. I think it’s telling that the top 50 teams can all shoot at least a little, and with some volume.

The teams are sorted by Q-E, explained below.

Team Rank 3P% FT% 3PA% Vol VR Q-E
Cincinnati  37 31.8 266 64.6 305 36.7 75 1167.1 75 -191
Illinois  36 32.8 211 71 116 40.9 28 1341.5 37 -183
Wisconsin  5 34.7 121 62.4 328 39.3 44 1363.7 30 -77
Iowa  34 30.4 304 72.1 77 31 230 942.4 122 -74
Akron  46 34.5 134 66 268 37.3 65 1286.9 45 -69
Wichita St.  35 34 164 68.6 197 35.8 101 1217.2 59 -63
Virginia Commonwealth  22 34.5 129 68.6 199 37.1 69 1280.0 48 -60
Nevada Las Vegas  30 32.7 214 70.4 137 33.8 156 1105.3 89 -58
Denver  42 36.7 53 74.2 34 45.2 3 1658.8 1 -50
Baylor  49 33.8 173 68.5 203 34.6 134 1169.5 73 -39
Iowa St.  38 37.3 42 72.9 61 43 12 1603.9 5 -30
Marquette  24 29.7 317 73.8 41 27.2 298 807.8 140 -19
Arizona  19 36 73 74.1 35 37.7 59 1357.2 33 -14
Oklahoma St.  15 32.4 229 74 38 31.3 219 1014.1 106 -10
Syracuse  9 32.2 240 68.4 205 30.9 235 995.0 110 -5
Mississippi  41 34 163 69.4 168 33.5 161 1139.0 83 -2
Florida  1 38.4 22 68 217 41.4 25 1589.8 6 3
San Diego St.  26 33.5 183 68 218 32.5 190 1088.8 91 7
Louisville  3 32 251 71.1 114 29.9 259 956.8 116 8
Oregon  39 31.3 283 71.8 91 27.8 292 870.1 138 9
New Mexico  28 34.7 120 72.7 66 34.5 136 1197.2 66 16
Belmont  32 38.6 15 72.7 65 40.2 32 1551.7 8 17
Missouri  27 33.5 185 75 23 31.8 205 1065.3 98 20
St. Mary’s  18 38.6 15 72.9 59 38.4 51 1482.2 16 36
Creighton  20 41.8 2 74.8 25 39.4 41 1646.9 3 39
Miami FL  13 35.5 90 65.9 270 34.1 147 1210.6 63 57
Minnesota  17 32.6 219 68.9 186 29 278 945.4 121 59
St. Louis  25 35.7 81 70.1 145 34 150 1213.8 61 69
Connecticut  47 35.9 77 75.1 21 34.2 146 1227.8 56 69
Michigan  10 38.5 20 70.8 122 35.3 106 1359.1 32 86
Georgetown  14 35.7 83 68.1 215 31.8 204 1135.3 84 121
Kansas St.  33 35.8 80 69.2 176 31.9 201 1142.0 81 121
Colorado St.  23 34.1 158 71.7 94 27.8 293 948.0 120 135
Colorado  43 34.5 136 67.3 240 28.4 286 979.8 113 150
Ohio St.  11 36.1 71 70.1 150 30.7 242 1108.3 88 171
Indiana  2 42.6 1 74.8 27 32.9 173 1401.5 25 172
Notre Dame  45 37.4 40 70.1 149 31.2 223 1166.9 76 183
Michigan St.  12 35 110 70.3 139 27.1 300 948.5 119 190
Kansas  8 35.9 75 72.4 68 29.4 271 1055.5 101 196
Duke  6 41.6 3 72.2 76 32 200 1331.2 39 197
North Carolina  31 36.3 66 65.8 276 29.5 269 1070.9 95 203
UCLA  48 34.5 130 71.6 97 23.3 335 803.9 141 205
Pittsburgh  7 35 108 66.3 260 25.6 317 896.0 131 209
Gonzaga  4 37.9 33 71.9 87 30.5 246 1156.0 77 213
Virginia  16 40.4 6 71.5 100 31.1 227 1256.4 53 221
Kentucky  29 36.6 58 64.8 301 28.9 282 1057.7 99 224
Memphis  40 36.5 59 67.7 230 27.6 296 1007.4 109 237
Middle Tennessee  21 38.5 19 69.1 181 26.8 303 1031.8 102 284
North Carolina St.  44 40.2 7 68.2 210 22.9 339 920.6 126 332

Q-E is pretty self-explanatory:  It’s 3PA% rank minus 3P% rank. (The Excel columns were “Q” and “E”. Yeah, I’m a big thinker.) As an example, Cincinnati is the first team listed with a -191. They’re 75th in 3-pointers attempted, and 266th in accuracy. 75 – 266 = -191. My suspicion is that the teams with large negative numbers are going to shoot themselves out of the tournament at some point. Offhand, I’d also guess that those teams lack a guy who can create his own shot, or slash and kick, leading to some desperation heaves late in the shot clock. I’ve seen Cincinnati. It doesn’t feel like an unrealistic set of assumptions. Watching them the other night I kept saying “They look really disjointed…”

On the other hand, the strongly positive teams may benefit from shooting more 3’s. That might bode well if they happen to fall behind and are forced to try to catch up quickly.

It’s interesting to me that there are only two “top-50” teams at worse than -100 “Vol”, but twenty-two teams at better than +100. A large percentage of the top teams are relatively judicious with their 3-point attempts. My guess is that the unwashed masses are shooting a lot of 3’s that they shouldn’t be, but they’ve got to create offense somehow, so that’s how it goes.

If I was smarter I’d be able to do a regression of 3P% vs FT%, I’d expect that there’s some positive correlation to it. At the very least, it illustrates that Cincinnati can’t shoot free throws, either. Poor free throw shooting may do them in, too.

Final note. I like Florida, but their 6th-ranked “Vol” score kinda gives me the heebies.

Burn After Reading mini-spoiler below.

What Year Is It?

By Blaidd Drwg

You have probably already seen this State Farm commercial featuring Kerry Wood and Andre Dawson…

But have you seen the blooper reel?

I guess it proves you should never work with baseball players or insurance agents when shooting commercials.

The New NBA CBA

by A.J. Coltrane

Zack Lowe of Grantland/ESPN on the impact on the trade deadline of the new NBA Collective Bargaining Agreement.

I don’t think he has a high opinion of Dwight Howard:

People seem to forget this, but we also had three massive deals between August and late January, two of which — for Rudy Gay and James Harden, respectively — were motivated at least in part by the new CBA. (The third was the Dwight Howard deal, motivated by candy and whatever else motivates Howard’s “camp.”)

A Different Take on Hall of Fame Voting

By Blaidd Drwg

To become eligible to vote in the annual Baseball Hall of Fame election, you need to be a member of the Baseball Writers Association. To become a member of the BBWAA, you need to cover baseball and be voted in by a committee (which is why some of the more brilliant baseball writers out there, like Rob Neyer, are not part of the BBWAA). Once you are a member of the BBWAA, you are a member for life, even if you stop covering baseball.

This causes a ton of issues during the Hall of Fame election process since there are a large number of the 575 ballots that are in the hands of “writers” who either no longer cover baseball or no longer follow baseball. Most of the articles that you will read about the Hall of Fame voting process are about why someone is or is not voting for a particular player. Espn.com recently posted an article by T.J. Quinn about the election process. This one was slightly different – Quinn is no longer turning in his ballot for what I think is a very good reason. It is a bit of a long read, but I recommend it.

Quinn questions whether he is qualified to vote, and it isn’t just about steroids:

Even before the issue of performance-enhancing drugs overwhelmed the annual conversation, I questioned my capacity to evaluate a player’s fitness for immortality. My only qualification, like all voters, was 10 years’ service as a BBWAA member. But nothing in my years as a beat writer covering the Chicago White Sox and New York Mets, and nothing in my years covering doping as an investigative reporter since has prepared me to evaluate the effect PED use should have on a player’s legacy.

He also makes a point that I think few who argue that the steroid players should not be in the hall consider:

The argument hits a serious roadblock, however, when it is applied retroactively. Mickey Mantle, Willie Mays, Hank Aaron and countless others have admitted they used amphetamines during their careers. If they used today and were caught, they would be suspended under baseball’s rules. I don’t know anyone who wants to think about pulling those beloved players out of the Hall, even though one of the few studies ever done on PED use showed that amphetamines clearly enhance athletic performance.

I have asked this question before, where do you draw the line? Do you take out the guys who admitted to cheating if you make the argument that you won’t vote for Barry Bonds because he cheated? Can you prove that Cal Ripken never took anything, despite him claiming he did?

Quinn also sums this up nicely:

I’ve heard other writers say they couldn’t wait for certain players to make the ballot so they could leave their names unchecked. Eddie Murray’s name came up that way more than once. I voted for Albert Belle because I thought he was one of the most dominant players of his era. He didn’t get enough votes to stay on the ballot, in large part because of the way he treated reporters. He cursed me out a handful of times, but he also asked me how my grandmother was years after she had a stroke. I tried hard not to let either element influence the way I evaluated his career; and to me, he belonged. Robin Ventura might have been my favorite player to cover, both with the White Sox and the Mets, but that wasn’t reason enough to vote for him.

But at the end of the day, the game, the Hall and journalism would be better served if voting was limited to a select group of veterans, historians and even journalists — if they’re the right journalists. Columnists and national writers who have devoted their careers to the game, not dabblers. That wouldn’t solve the problem of how to evaluate players in the age of modern chemistry, but at least the right group would be making the call.

I have to agree with him. The process has too much bias in it, which has led to a good number of substandard guys getting elected to the Hall because of poor evaluation of their careers and they were “liked” by the media.

I don’t know if there is a better system, but the one we have isn’t very good. Heck, I would be happy if the BBWAA changed its procedures so that if you have not been covering the game for 5 years, you don’t get to vote for the Hall of Fame. I will be honest, that is about as likely to happen as pigs flying.

Baseball Card Vandalism

By Blaidd Drwg

Ok, so the person who did these is no Picasso and some are crude but some are actually funny and could be great if someone with photoshop skills got a hold of them. These kind of remind me of Wacky Packages or Garbage Pail Kids. My two favorites:

The art may actually be a slight improvement over the actual face of Rick Rhoden, who isn’t nearly as unattractive as Julian Tavarez